Understanding Internet Speed Test Results
Testing your mobile internet speeds while RVing is the best way to monitor your performance over cellular, Wi-Fi and satellite.
Testing internet speeds allow you to measure your real-world performance to know if your signal enhancing efforts are having an impact.
While the bars displayed on your device are a quick visual indicator - they are relatively meaningless in the effort to determine your mobile internet data performance.
Each device manufacturer uses its own formula for coming up with what determines 1 bar versus 4 bars.
And usually, bars have nothing to do with how fast your connection will be. There's a lot going on behind the scenes that can affect your data performance, whether you are connecting to a Wi-Fi network, cable, satellite, or cellular internet data source.
And the best quantitative measurement of this is the download and upload speeds you actually get. And of course, just monitoring the relative reliability of your connection.
If you're a member, please log in above to see your exclusive content.
Don't need a membership? Other ways you can support our work here:
-
As seen in our videos!
-
Get a FREE Month of Starlink!
And our team will get one too!
-
Get a FREE Month of T-Mobile Unlimited Data
Join the Calyx Institute, and get a bonus month - and we do too!
-
Save $20 on Visible
Verizon's prepaid phone plan, we also get a $20 credit.
-
Leave a Tip!
Send our team some beer money!!
-
Share About Us!
Link to our content, tell others about MIRC. It's Free!
It is with huge gratitude to our members for making the free unbiased educational content on our site possible. We're not sponsored, you'll find no 3rd party ads and we don't sell gear or data plans.
Our members get exclusive access to our in-depth content, classrooms, vendor discounts (that can save you more than membership!), alerts, insider info and interactive guidance. They can even book private advising sessions.
If mobile internet is an important part of your lifestyle, consider helping make MIRC possible by joining or supporting our mission.
Testing Mobile Internet Speeds Video Overview
Enjoy this quick video recapping the importance of performing speed tests to determine your mobile internet data performance:
Be sure to Subscribe to our YouTube Channel for more video guides & news updates.
Testing Internet Speeds Services
There are many free apps and websites designed for testing internet speeds, regardless if your connection is cellular Wi-Fi or satellite. These services allow you to send a chunk of data to their servers and they measure how long it takes.
Before you run any speed test app, you should keep in mind that the various speed test apps calculate speeds differently and use different servers and methods, which can affect results.
In other words, results from one app are not directly comparable to another.
Speed Test Apps
There are numerous speed testing services and apps, these are the most popular ones.
- Ookla Speedtest (www.speedtest.net) - The most widely used speed testing service. App versions are also available for Windows and Mac.
- Ookla Speedtest App (www.speedtest.net/mobile/) - For iPhone, iPad, Android, and Windows phones. The app includes an option for video speed testing, but the Ookla video tests will not detect throttling like Netflix's Fast.com (see below) will. The app version on both iOS and Android provides a map tool that shows the type of coverage available in locations across the country. The iOS app will measure ping at three different stages: idle, download, and upload.
- NPerf Speedtest (https://www.nperf.com/en/) - Runs a suite of very comprehensive tests covering general, video, and browsing performance. Also has a crowd-sourced coverage map. Has a website as well as mobile apps.
- Coverage? (https://twostepsbeyond.com/apps/coverage/) For iPhone and Android phones. This is a cellular coverage app with a speed testing feature. It shows 5G, LTE, and roaming for Verizon, AT&T, T-Mobile, and US Cellular, and has integrated Ookla's SpeedTest into the app (Note: Coverage? was developed by the Mobile Internet Resource Center's founders Chris and Cherie).
- Cloudflare Speed Test (https://speed.cloudflare.com) - A fabulous and ad-free web-based speed test from Cloudflare, one of the largest internet infrastructure providers.
- Netflix's Fast.Com (www.fast.com) - Uses Netflix-hosted video files for testing, so a great way to check to see if your carrier is throttling video streaming when compared to other speed test services. By default, they show just download speeds as applied to a video file - since that's what's important to stream video. The reading you get here will likely differ from other speed test services, as it will reflect any video resolution throttling speeds in effect (for instance, if your data plan only allows for 780p resolution, fast.com may reflect only 3-5 Mbps speeds, whereas Ookla's app might show 38 Mbps which is the speeds you'd get for non-video web surfing). You can click on "Show More Info" to get access to upload speed and latency results.
- Starlink Speed Test (App Only) - Built into the Starlink app, this speed test has two screens. The main speed test screen is similar to Ookla and others and shows download, upload, and latency. There is also an "Advanced Speed Test" that breaks the test down to a test between the router and the internet, and the router and your Wi-Fi device showing both download and upload speeds for both. This helps determine if your speed is being held back by a low device to router connection which should always be higher than the router to internet connection. Note: The main speed test tends to be very optimistic and there is speculation you are just testing between your device and Starlink's internal network. Ookla and other speed tests tend to give a much more reasonable result of your overall network speed.
- Speed Of Me (www.SpeedOf.Me) - A web-based speed tool that runs in most browsers.
- Meteor by OpenSignal App (meteor.opensignal.com) - For iOS and Android. Meteor is a speed test app from the network performance measuring firm, Open Signal. It's intended as a complement to the Open Signal app, which is a more technical app geared toward cellular signals and tower locations.
- Wehe App (dd.meddle.mobi) - This is a university research project related to net neutrality. The app tests several video and audio streaming, plus videoconferencing services to determine if there is any throttling in the connection. It can be a really handy tool if you're having issues with a particular app.
- Google Fiber (speed.googlefiber.net)- Website that provides basic speed tests with no control over server location.
- FCC Speed Test (App Only) - The official speed test from the FCC as part of the agency's Broadband Data Task Force. One nice feature is that it has optional limits on mobile data use.
Crowdsourced Resources
There are also several crowdsourced coverage map and signal map apps out there - like Open Signal. These resources might also include the functions for testing internet speeds for a cellular device.
Please don't use these crowdsourced apps for *testing* your signal enhancing efforts.
The results of these speed tests get recorded in a central database for sharing about your current location with others. Adding in your experimental data with boosters & antennas can skew the results for everyone.
You should only report speeds to these crowdsourced resources using your baseline readings - unenhanced - without boosters & antennas. That's the data these apps are looking to record so that other users know what to expect.
Remember, not everyone travels with boosters and antennas.
Setting Up for Testing Internet Speeds
Many of the speed test services on the market are available as either an app you install on your mobile device or via a web browser.
Testing internet speeds start by simply bringing up the app or website and clicking the start button.
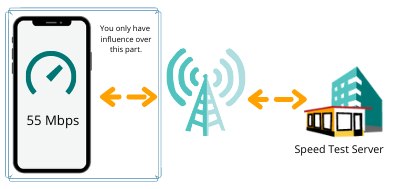
What happens next is that a chunk of data is sent from your device to a server they have access to, which is usually chosen by location. The amount of time it takes to send that file to the server and receive it back is what determines the results the app displays.
However many factors, including your device and their server, can influence those results. And only some of those variables are within your control to optimize.
Determine What You Are Testing
Before diving into testing internet speeds, decide what exactly you are trying to test so that you can best determine how to set up your testing parameters.
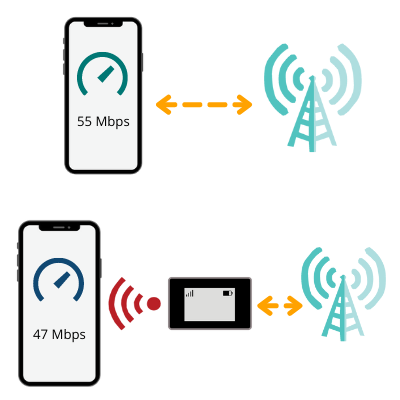
If you want to know the speed your smartphone is receiving with its installed data plan, then run a speed test app on your phone without being connected to any Wi-Fi sources. In fact, turn off the Wi-Fi radio to make sure your phone doesn't connect to a nearby router or hotspot. This will give you the direct on-device data performance reading.
If you are testing the mobile internet speeds of your mobile hotspot device, router, or your smartphone's personal mobile hotspot feature - you need to connect your phone or computer to that device over Wi-Fi or Ethernet. And then run the speed test on your testing device while connected. Most hotspots and routers don't have the ability to run a speed test directly.
The connection between your router/hotspot and the device you are running the test on (your phone or laptop) will have some influence on the results. But then again, this is how you access the data connection of your router in real life anyway.
It is completely expected that if you test the same cellular carrier on your phone directly, and then via your phone connected to a router or hotspot, that you'll get different results simply because of that extra local area networking hop. Each networking hop can add a bit of performance degradation.
Anticipate differences too due to the modem of the devices you are testing, or how the carriers might treat smartphone on device data versus hotspot data.
Isolate Variables
To get reliable results for testing internet speeds to determine if your performance enhancing efforts are having an impact, you really need to isolate as many outside factors as you can.
Here are just some of the variables at play in your local environment that could influence speeds:
- Multiple Wi-Fi devices in the same area can cause congestion and slow speeds down. Minimize the number of Wi-Fi signals in the area (including not running a microwave oven during testing!).
- Other devices in your household connected to the same internet source your testing against can gobble up the available bandwidth. Definitely don't perform testing while doing large file downloads or uploads.
- Connecting over 2.4 GHz or 5 GHz Wi-Fi will alter the results, as will using Ethernet. Whichever you are using, keep it consistent during and between tests.
- The distance between devices when connected over Wi-Fi can also make an impact - the further from the source of the signal, the slower your speeds will be. Keep any distances consistent during testing.
- The placement of your devices can impact performance. Line of sight to the internet source helps signal, and building materials like metal can block wireless signals.
- The server load on the speed testing service you're using can give you strange readings (see below for more optimization tips).
- Multiple cellular devices within range of a booster's interior antenna can divide up the enhanced signal. Only have one cellular device turned on when testing boosters.
Also, when possible, use the official testing app or website for the speed testing service. Speed testing functions that are built into the firmware of devices tend to be buggy and not frequently updated, skewing results.
It's best to test each component as individually as possible. Turn devices off or put them into airplane mode that aren't involved in the testing. Keep distances and line of site as consistent as possible, and don't make microwave popcorn while testing (eating it however is fine.)
Don't forget, there's a whole bunch of other things that can impact your data performance - from your gear, data plans terms, signal strength, frequency bands, congestion, terrain and more. These are thing things you might be trying to optimize and test to see if they're having an impact.
Consult our guide to Understanding & Optimizing Cellular Data Performance to dive deeper.
Running Speed Tests
We recommend that you first take a baseline reading for each internet source without any signal enhancing, so you know what you're starting with. For instance, take a reading from your mobile hotspot device without any antennas, or test your router with its default antenna configuration.
Next integrate your options one at a time (such as antennas, directional antennas, booster, band locking, bonding, switching internet sources) and test each. Run 3-5 tests for each combination and look at the average results. Anomalies can happen, and the speed testing servers themselves can impact the results.
Here's an example of the testing data we collect, in this case comparing different cellular boosters with AT&T and Verizon hotspot devices:

Hopefully you'll find a combination of performance optimization techniques that gives you suitable performance at this location.
For more on optimizing your setup at each location and the steps you might want to take to find your best internet performance, head on over to our Setting Up and Optimizing Mobile Internet at Your New RV or Boat Location guide.
Testing Internet Speeds Results
While each app or service will deliver a different sets of results, these are some of the typical indicators you'll get when testing mobile internet speeds:
Latency (aka Ping)
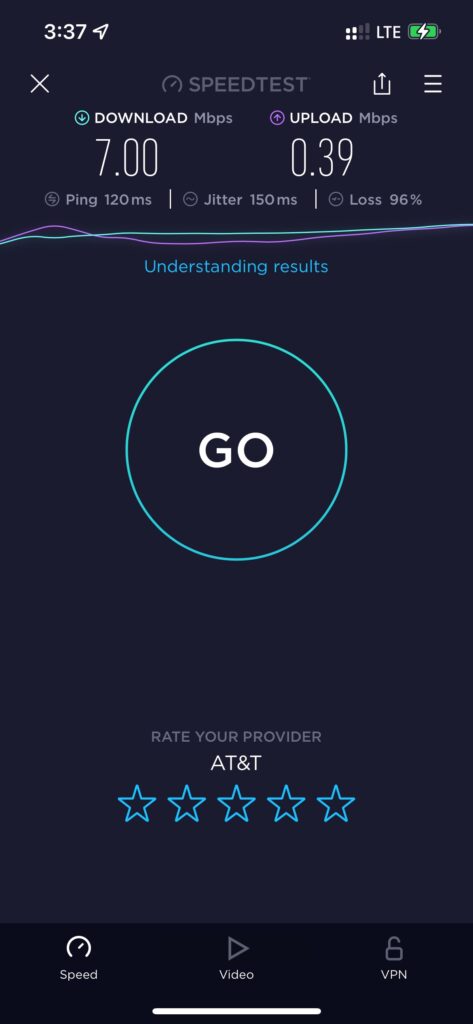
This is the time in milliseconds it takes for a request from your computer to reach the speed-test server and to return, like the ping of a ship’s sonar. The higher the number, the slower the speed.
On 4G/LTE, latencies under 100ms are good, under 50ms are great and 20ms is about the best you can hope for. Ping times over 100ms can feel painful and are a sign of unstable conditions.
On standalone 5G not riding over LTE frequencies, latencies can be under 10ms.
Unusually high latencies are often a sign of an unreliable connection - indicating that the cellular tower is needing to resend data multiple times to get through successfully.
This measurement is particularly important for online gaming, but any interactive task can begin to suffer from higher latencies. For general surfing, it will be noticeable as that blank pause when you first request a new website.
Jitter
Jitter is an indication of how much the connection latency varies from moment to moment. The higher the number, the worse it is.
Single-digit numbers indicate a more stable connection.
Packet Loss
Some apps report a percentage of “packet loss.” Think of this as letters lost in the mail. Substantial and persistent packet loss on a connection means the connection is unreliable, and web pages may not reliably load (for instance, you may be noticing images not loading and displaying a little 'Red X' instead). Zero is of course ideal, and even 1% packet loss can make a connection feel unreliable.
Download Speed
Reported in either kilobits per second (Kbps) or megabits (equivalent to 1000 kilobits) per second (Mbps). This is a measurement of the maximum speed that data is able to flow to you from the speed-testing server.
Here are some benchmarks:
- 50+ Mbps will be blazing fast and allow for multiple video streams, super-fast file downloads, and snappy browsing.
- 20+ Mbps will feel awesome for just about everything and large files will download pretty quickly. Over 20 Mbps is the minimum required for 4K HD video streaming.
- 5+ Mbps will give a solid surfing experience and will be suitable for most HD (720-1080p) video streaming, and is a good aim for two-way video conferencing.
- 3-5 Mbps will still feel snappy for most basic surfing, 720p and lower video streaming will still be pretty smooth. You likely won't feel these speeds as being slow unless you're trying to do super-high bandwidth things like download large files or stream 1080p video.
- 1-3 Mbps starts to make the modern internet feel slow but still usable. Even low res video (360-420p) streaming may still be possible with some buffering. Pages will load, but pictures might take a moment to fill in.
- Under 1 Mbps - can get downright painful for anything more than the basics.
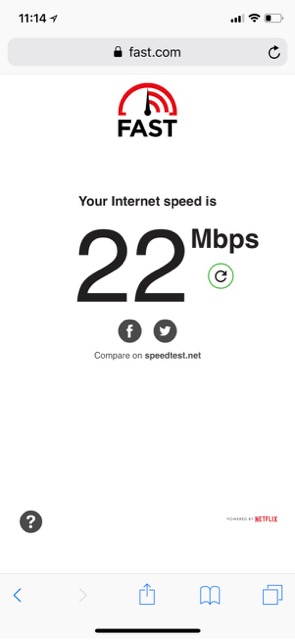
Download speeds have a particularly large impact on streaming audio and video. If the speeds aren’t able to keep up with the resolution you’ve selected, you will experience stuttering, pauses, and long buffering delays. And of course, the slower the speeds, the longer it will take to download large files.
Modern devices are capable of real-world speeds from 100-400+ Mbps when the conditions are right (the theoretical max of flagship devices can go over 1000 Mbps in ideal laboratory conditions).
But a reasonable target and expectation for good speeds on today's cellular networks is 25-100 Mbps.
5G devices have theoretical speeds of up to 10 Gbps although real world performance will be well under that!
However, outside of short-range high band mmWave 5G - most of today's 5G won't be much better than 'really good LTE' unless you're connecting over mid-range standalone 5G bands, where speeds into the few hundred Mbps range are possible and becoming a lot more common in semi-urban areas.
As long as you are getting around 5-20 Mbps speed you shouldn't stress too much about optimizing for more, unless you have some big downloads, 4K video, or are supporting multiple devices with heavy usage.
A reliable and steady connection is usually more important than achieving maximum speeds.
Upload Speed
The opposite of download speed, upload speed tells you how fast data is able to get from your device to the speed-test server.
Upload speeds are almost always lower than download speeds.
For one, more capacity is allocated to download speeds because it's the more commonly needed resource, but your own cellular device plays a role here too. Your device just don't have as much transmit power to send data back to the tower, and typically have fewer antennas dedicated to the task.
For many typical internet tasks, upload speeds don’t have a huge impact - as long as you have some upload capacity, that's all you need to send a request to download a webpage.
But, upload speeds are critical for two-way video chatting, video broadcasts, and uploading large files like photos, videos, or cloud-synced backups.
- 20+ Mbps allows for 4K video broadcasting and large files will fly through the internet.
- 10+ Mbps allows for smooth 1080p video broadcasts, and large file uploads should go pretty fast.
- 5-10 Mbps is pretty much needed for video broadcasting in 720p and will make large file uploads feel relatively fast.
- 1-4 Mbps should deliver smoother video chat results at normal resolutions, make web surfing feel snappy, and moderate-size files should upload within a reasonable amount of time.
- Under 1 Mbps and even general web browsing will feel sluggish, and the lower the speed the less reliable your overall connection is.
Most modern modems are capable of real-world upload speeds of 50Mbps, and some flagships ones support up to 150Mbps.
But a reasonable target and expectation for upload speeds in good signal conditions with modern equipment is 10-50 Mbps.
As long as you have enough capacity to get done what you need, don't stress too much about it. A reliable steady connection is usually more important than faster speeds.
TIP: If you see upload speeds faster than download speeds, that may be an indication that the cell tower is congested since there is usually more download demand on a tower than upload demand.
Testing Mobile Internet Speeds Best Practices
 Speed tests work by sending a large chunk of data from your device to a server on the internet, and measuring how long it takes.
Selecting Speed Test Servers
Each speed test service has its own set of servers, and the servers themselves can impact the results based on their current load and the distance from your current location. Including how many hops on the internet need to be taken to get to the server and back.
This can cause speed test results to have variability which may not have anything to do with your current signal conditions or gear.
Most speed-testing sites and apps have a way to change the default test server, letting you select a different server to communicate with and test against. Trying different servers can help you rule out whether strange results are isolated or not.
It's very common to notice variability between different servers, as the traffic is routed differently to reach the destination. When conducting testing against different gear and optimizations you're making to tweak your setup, keep your testing server consistent to rule out that variable.
It's important to note that the server you select inside a speed testing service has no impact on your regular web traffic.
Aside from pinging against the server for the speed tests, your normal web activity will not be routed through this server. In other words, selecting the fastest speed test server will not speed up your video streaming, file uploads, or web surfing.
Speed Tests are Just a Snapshot
An individual speed test is just a snapshot of the current conditions - and not always an indicator of how your connection will be later in the day when weather moves in or your local tower or Wi-Fi hotspot becomes overloaded.
To get a sense of the actual health of your connection you can run several speed tests over the course of the day. Doing this can help you get a better sense of what average speeds you are actually achieving.
The best indicator is just taking note of how your connection behaves over the course of the day. Are you noticing drop-outs, slowdowns, or large files taking a long time to transfer? Something things you can adjust for in your setup, but others things will simply be outside of your control.
Testing Internet Speeds Uses Data
Because each speed test you run is using data files to test against, data is being used from your data plan. Try to minimize the number of tests you run, especially if you have data caps or network management thresholds. It makes no sense to use your monthly allotment on speed tests, and not the stuff you actually need to do online!
And the faster your connection, the more data is used for the test.
Here are some examples of data usage at different speeds we took when using the Speedtest app by Ookla (data used per speed test):
- 4.5 Mbps down / 1.53 Mbps up - 8.6 MB
- 16.9 Mbps down / 4.79 Mbps up - 39 MB
- 43 Mbps down / 3.80 Mbps up - 58 MB
- 86.3 Mbps down / 61 Mbps up - 88 MB
If you have caps on your data plan, you can easily burn through them just by speed testing!
Member Exclusive Content Below
Member Exclusive Content In This Guide
Has this guide been helpful so far?
Well.. there's a lot more below available to our members. As well as dozens of other guides like this, videos, classrooms, forums, webinars and more. All specifically created for helping keep RVers, cruisers and nomads online.
Consider Becoming a Member
If mobile internet is an important part of your lifestyle, a membership can help keep you connected with these exclusive benefits:
- in-depth exclusive content
- interactive guidance
- vendor discounts
- alerts & insider tips
- classroom
- community
Free Content Like This Made Possible By Our Members!
We are community funded via our premium membership program - allowing us to focus on creating unbiased quality, in-depth, constantly updated content. We don't accept 3rd party advertising, we're not sponsored and we don't sell 'stuff'.
Already a member?
Log in to continue with this guide.
Check out the Topics Covered in the Member Section:
Device Indicators
While the bars on a device might not tell you much, your device usually reports other information if you know where to look. Learn more about raw signal readings and SNR, RSSI and RSRQ and where to find this information on smartphones, hotspots and routers.
And also how carrier aggregation plays a role too.
Conclusion: Understanding Data Speed Results
When testing signal strength, bars aren't the most reliable method. A better measurement is testing your upload and download speeds. There are several free services to help you do this.
There are many different variables that can impact your results. It's best to isolate as many variables as you can. And run tests multiple times so you can ensure you are getting accurate information.
Knowing how you use your data is important for analyzing the type of data speeds you are getting. Download speeds are important for streaming audio and video files. Upload speeds are important if you're going to do two-way video chatting, video broadcasting, or uploading large files.
Don't forget to keep an eye on your data usage as testing your speed can use up a good bit of data itself.
Additional Reading
Related Guides
- Understanding & Optimizing Your Cellular Data Performance
- Setting Up and Optimizing Mobile Internet at Your New RV or Boat Location
- Understanding Cellular Modem Specifications (Mobile Hotspots, Routers, Phones)
- Getting a Better Wi-Fi Signal for RVs and Boats
- Video Conferencing & Broadcasting Over Mobile Internet
Explore the Resource Center
Have Questions?
Join our 'Library Desk':
Internet for RVers & Cruisers Facebook Group
We cross post news articles and guides, and can help point you in the right direction to our content here on the resource center.
It is with gratitude to our premium members that we're able to offer our free content - and for that, they also have access to our member Q&A areas for more in-depth guidance.
Become a Member
 The MIA is our premium membership - designed for those who consider mobile internet an important part of their lifestyle.
In thanks for making content like this possible, we offer a bunch of additional perks. From interactive guidance, in-depth member exclusive content, discounts, alerts, classroom and ability to book private advising sessions.
Stay In the Know
We're constantly tracking the industry and analyzing new developments for mobile travelers. If you'd like to receive updates, we offer several ways:
- Subscribe to our free monthly newsletter
- Subscribe to our News Stories RSS Feed
- Subscribe to our YouTube Channel
- Follow our Facebook Page






 Mobile Internet Resource Center (dba Two Steps Beyond LLC) is founded by Chris & Cherie of